By Jim Berg, Minnesota Department of Natural Resources
Minneapolis grew up along the banks of the Mississippi River because the mills were able to exploit the power of St. Anthony Falls to turn wheat into flour. For many years water from the river could easily be used for the other human needs of drinking, cleaning, and yard watering. But the post-World War 2 era required a whole new water supply strategy with the explosive growth of the suburbs. As communities grew farther away from the river it was no longer cost-effective to pipe and treat water from the river.
A few hundred feet underground were the aquifers of the Prairie du Chien Group (mostly dolostone) and the Jordan Sandstone. These water sources were simply much easier to use with less pipe and treatment involved. We have known for a while that the water levels in these aquifers have been going down because of high-volume pumping by multiple communities in eastern Hennepin County, each with multiple wells (Sanocki and others, 2008).
The most recent and historic conditions of these aquifers are examined in the recently completed Groundwater Atlas of Hennepin County, 2021. The report is a comprehensive look at a wide range of groundwater characteristics and conditions in the county. Perhaps one of the most interesting topics is the steady depletion and possible stabilization of the Prairie du Chien and Jordan aquifers in eastern Hennepin County.
Groundwater use and water level monitoring
In Hennepin County, the highest volume use (2018) was from the combined Prairie du Chien and Jordan aquifers at 41 percent (over 12 billion gallons/year), followed by the Jordan aquifer at 22 percent (over 6 billion gallons/year). Other significant use includes the water table aquifer at 11 percent (over 3 billion gallons/year) and buried sand aquifers at 9 percent (2.6 billion gallons/year). The most common water use is for municipal/public water supply at 90 percent, which dominates in the highly populated suburban eastern Hennepin County.
The DNR maintains a statewide groundwater level monitoring program. Long periods of record from monitoring multiple aquifers are useful for determining trends and to provide insight into how aquifers respond to recharge events, climatic conditions, and pumping stresses. A well near Lake Minnetonka has been monitored since 1945 (Prairie du Chien–Jordan well, Figure 1). High-capacity municipal pumping since the 1970s has created a persistent partial depletion of these aquifers. Decline appears to have stabilized in recent years.
The Prairie du Chien–Jordan hydrograph at Minnetonka Boat Works is near the eastern end of Lake Minnetonka in Orono (Figure 2). This hydrograph (Figure 1) shows short (annual), medium (several years) and long-term (decades) trends. The short-term trends are caused by increased pumping during the summer and early fall. Beginning in the late 1950s, the summer season low water levels typically have not returned to the yearly high-water levels of the previous year, creating a steady decline.
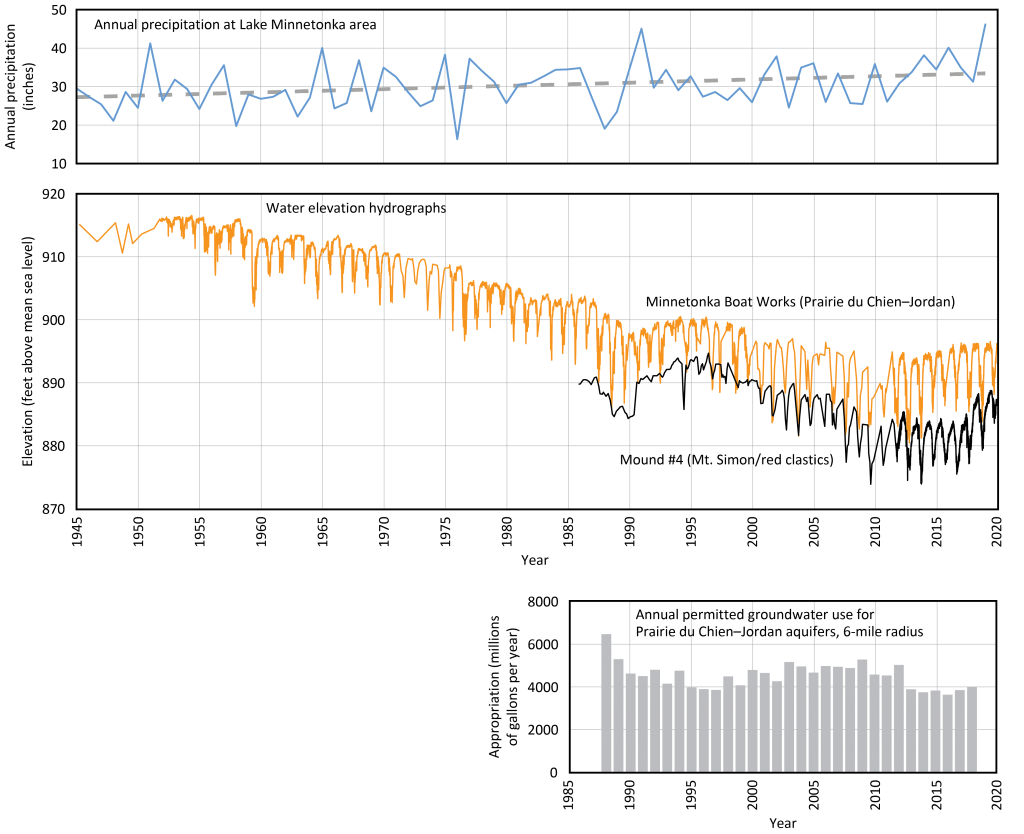
Figure 1. Minnetonka Boat Works hydrograph, Prairie du Chien and Jordan aquifers (Groundwater atlas of Hennepin County, report page 78, figure 50).
Hydrograph represents the groundwater use the Prairie du Chien and Jordan aquifers within a 6-mile radius (lower graph), as well as precipitation from 1945 to 2018 (upper graph). The middle graph is one of the longest water-level records in the TCMA and monitors the most heavily used combination of aquifers: wells that intersect both the combined Prairie du Chien–Jordan (OPCJ) and Jordan (CJDN). The shorter-term Mt. Simon aquifer hydrograph shows a similar depletion pattern.
The medium-term trends are illustrated by a comparison of the Minnetonka Boat Works hydrograph, local water use trends since the mid-1980s, and local rainfall patterns (Figure 1, upper graph). Since the mid-1980s groundwater use was relatively stable but fluctuated with the medium-term rainfall trends. For example, an overall increase in rainfall from 2012 to 2018 matched a reduction in groundwater pumping (Figure 1, lower graph) and a small increase in Prairie du Chien–Jordan water levels. This pattern commonly occurs as fewer people water lawns during rainy periods. A drought during the late 1980s matches a several-year period of lower groundwater levels. This was followed by increased rainfall in the early 1990s and a recovery.
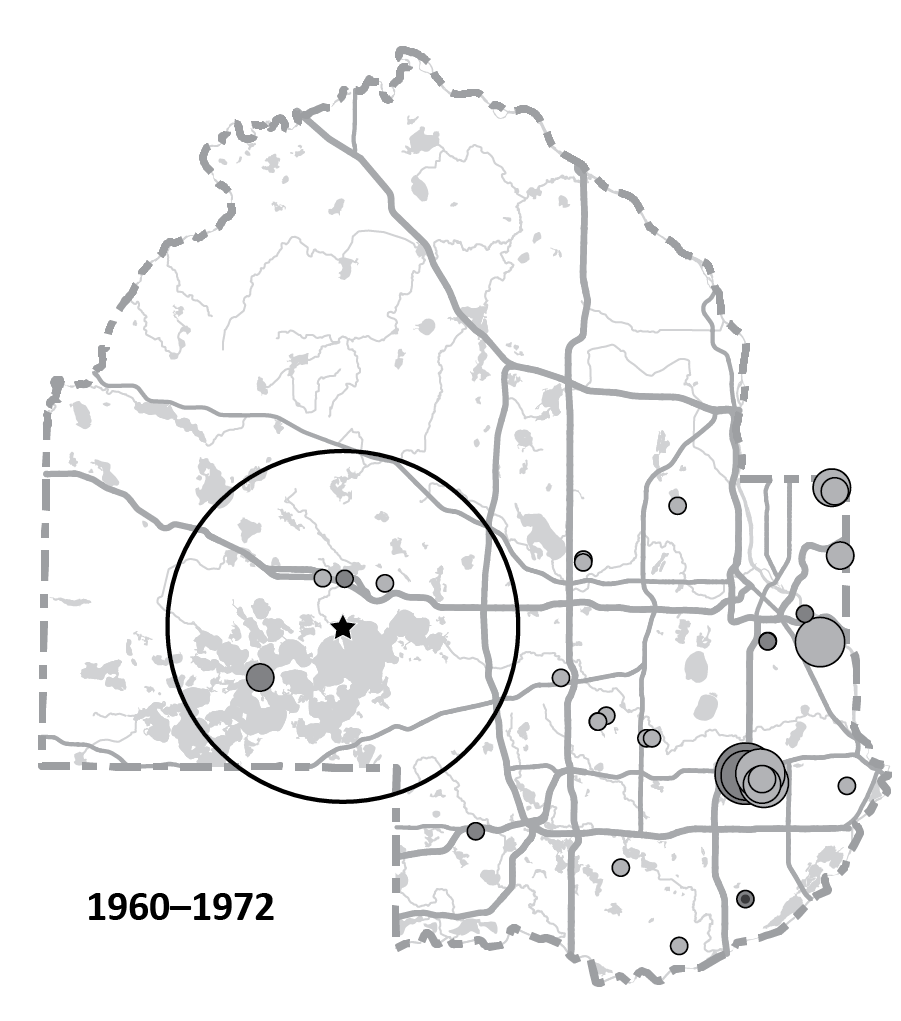
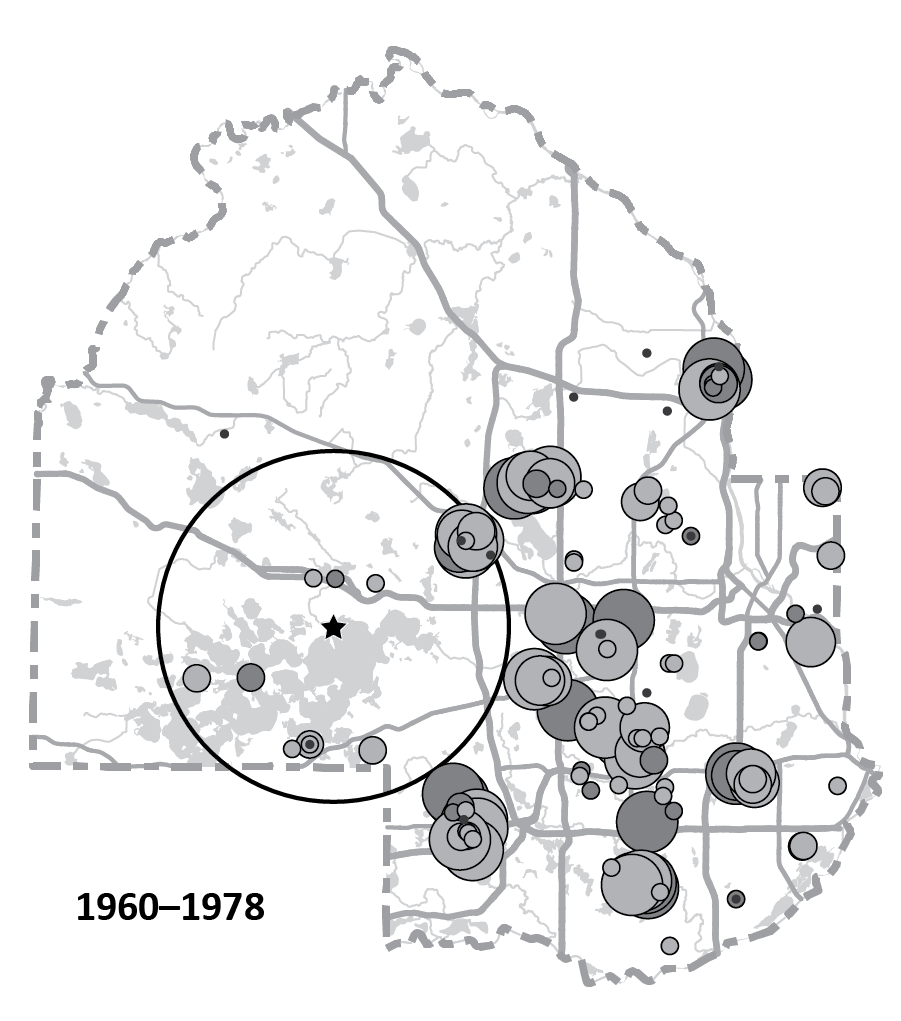
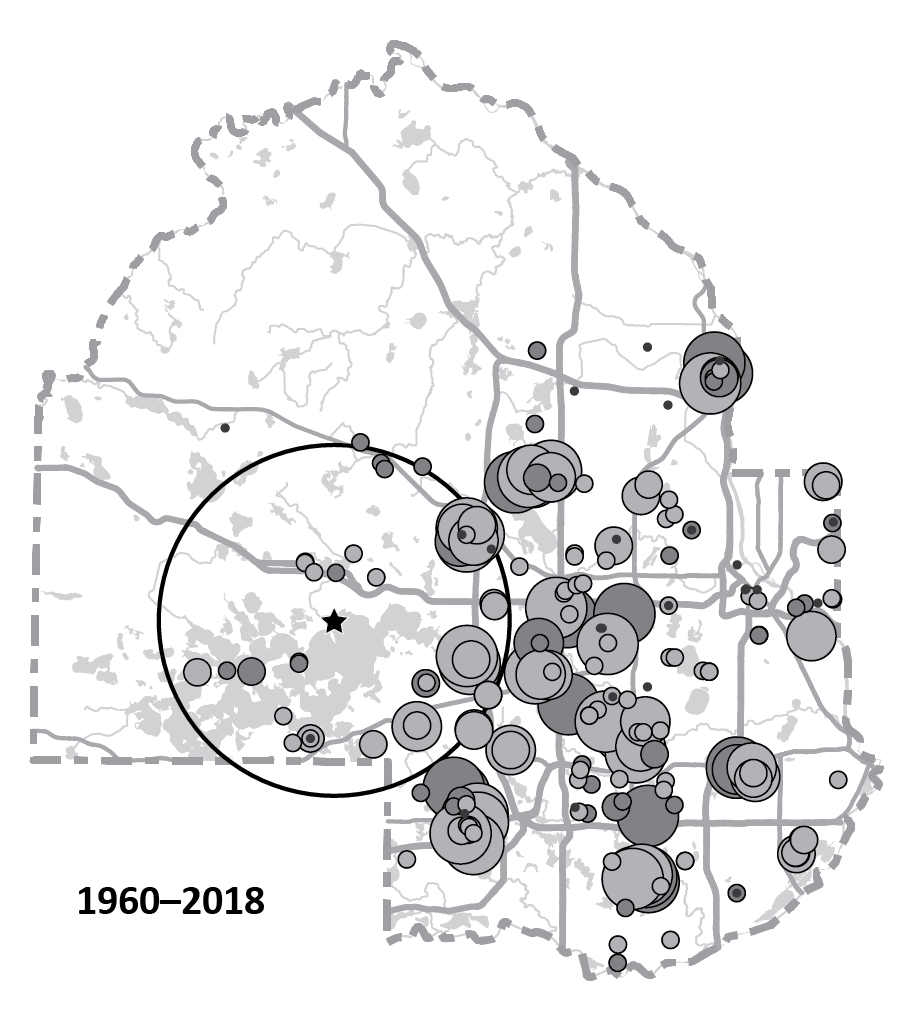
The long-term trends of combined Prairie du Chien–Jordan aquifers appeared to have two phases: declining water levels from the 1950s and the 1990s followed by stabilization and increasing levels from approximately 2010. Insights into the phases are provided by the history of permitted well installations near the Minnetonka Boat Works observation well and the urbanized area to the east (Figure 2). The Minnetonka Boat Works observation well is on the western fringe of an area of intensive groundwater use in the eastern portion of the county.
- From 1960 to approximately 1972 only a few high-volume permits were issued per year and only a few were within the local area of the well.
- From 1973 to 1978 there was a large increase in permits issued and associated groundwater pumping from the combined Prairie du Chien–Jordan and Jordan aquifers. This increased pumping in the 1980s through the early 2000s probably caused the steady decline of water levels shown on the hydrograph (Figure 1, middle graph).
- From 1979 to 2018, the number of permits issued declined to only a few per year. Water Levels appear to have stabilized since 2010 (though at a lower elevation). This may have been caused by the slowdown of additional pumping from new permits since approximately 1990, gradual increase in long-term rainfall, and conservation efforts.
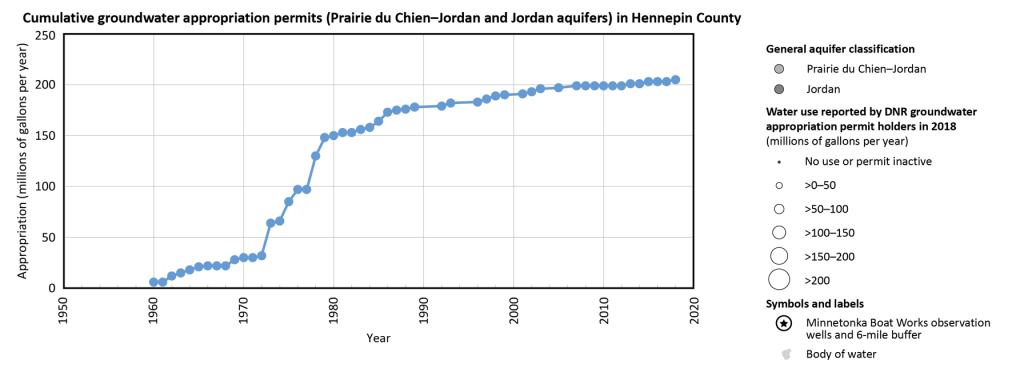
Figure 2. Groundwater use of the combined Prairie du Chien–Jordan and Jordan aquifers from 1960-2018 (Groundwater atlas of Hennepin County, report page 79, figure 51). From 1973 to 1978 there was a large increase in permits issued and associated groundwater pumping from the combined Prairie du Chien–Jordan and Jordan aquifers. This increased pumping in the 1980s through the early 2000s probably caused the steady decline of water levels in eastern Hennepin County from these aquifers.
Possible extent of the depleted area
The previous discussion focuses on one observation well on the western fringe of the TCMA suburbs that suggests a large and persistent cumulative depression cone. But what are the probable boundaries of this cone? Synoptic water-level measurements by USGS (Sanocki and others, 2008) in early spring and late summer of 2008 shows a seasonal depressed area in central-southeastern Hennepin with drawdowns that range from a few feet to greater than 40 feet (Figure 3). The Minnetonka Boat Works observation well is located on the west-central edge the depressed area of Hennepin County.
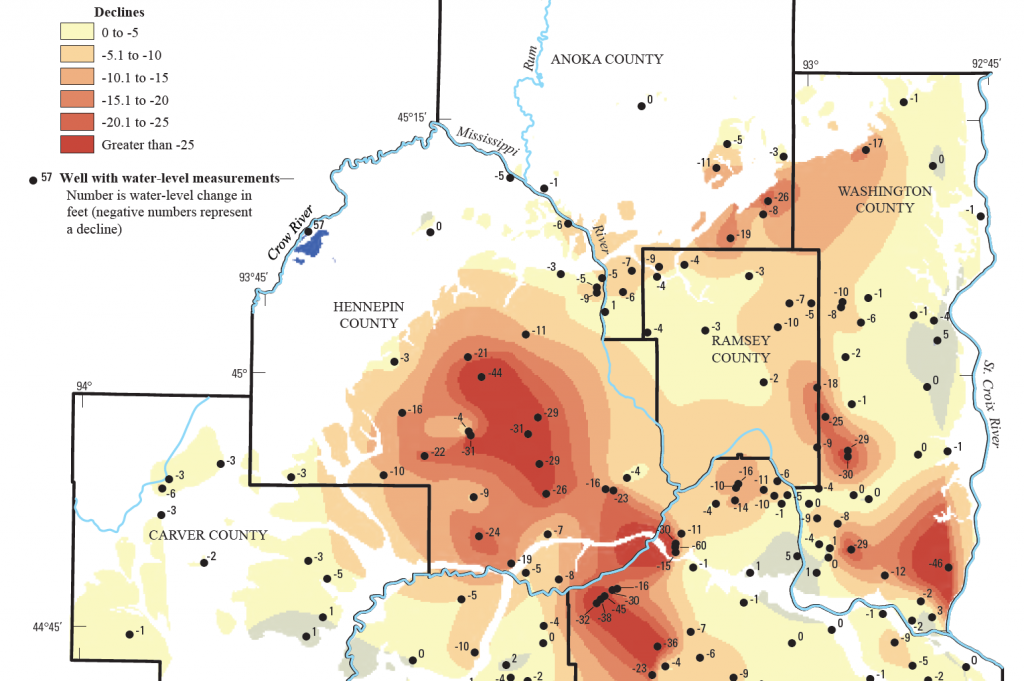
A seasonal “snapshot” of aquifer water level decline in 2008 was coordinated by the USGS to document the effect of the higher water use that is typical of this time of year.
Conclusion
The stable water-level values of the past approximately 10 years are an encouraging sign for sustainable use of these mostly suburban aquifers. But 10 years is not a very long time for evaluating a declining trend of over 50 years. What is clear however, is the value of these long-term data records for assessing the future of our important water sources, especially these suburban aquifers.
Cited references
Berg, J.A., 2021, Groundwater Atlas of Hennepin County, Minnesota: Minnesota Department of Natural Resources, County Atlas Series C-45, Part B, report, 3 pls., GIS files.
Sanocki, C.A., Langer, S.K., and Menard, J.C. 2008, Potentiometric surfaces and changes in groundwater levels in selected bedrock aquifers in the Twin Cities Metropolitan Area, March–August 2008 and 1988–2008: U.S. Geological Survey Scientific Investigations Report 2009–5226, 67 p. with appendices.
MGWA is committed to developing a just, equitable, and inclusive groundwater community. Click on the button below to read MGWA’s full diversity statement.
