Melinda L. Erickson, U.S. Geological Survey Research Hydrologist and UMN Adjunct Associate Professor
Emily C. Berquist, Minnesota Department of Health Hydrologist
Geologic-sourced (natural) arsenic is common at high concentration in Minnesota groundwater. Chronic exposure to high levels of arsenic through drinking water can cause certain cancers, skin abnormalities and other adverse human health effects. More than one million people in Minnesota (1 in 5 people) depend on groundwater from domestic wells as their source of drinking water. An estimated 1 in 7 domestic well users (150 thousand people) use groundwater sources with arsenic concentrations exceeding the U.S. Environmental Protection Agency’s drinking water standard, and about half (500 thousand people) have detectable arsenic in well water.
Well owners, well contractors, and drinking-water managers need to know where and why high-arsenic groundwater is likely to occur in order to take measures to protect public health. The U.S. Geological Survey, in collaboration with the Minnesota Department of Health and University of Minnesota, has been assessing the spatial distribution of groundwater arsenic concentrations in Minnesota, identifying factors affecting arsenic mobilization, and identifying ways to drill domestic drinking water wells with a lower risk of high-arsenic.
Our overall study objective is to better delineate and help explain groundwater arsenic concentrations in Minnesota through space and time. Our progress has been published in three recent journal articles, and the most significant findings are summarized below.
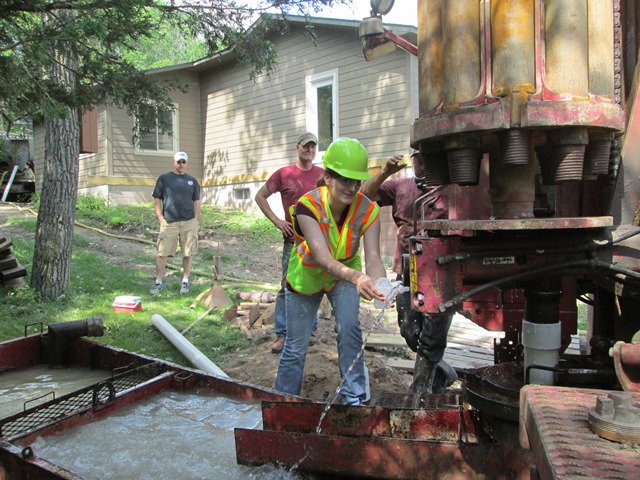
We evaluated the effects of geochemical changes that occur after well installation and operation on arsenic concentrations by aquifer type. Measurement of and mechanistic characterization of human-induced geochemical changes associated with drilling, installing, pumping, and sampling of drinking water wells can improve guidance to well owners and policy makers on when to sample wells. We examined changes in arsenic and other geochemical constituents over one year in water from 250 new domestic water wells (Figure 1).

Figure 1 – Minnesota Department of Health hydrologist Emily Berquist collecting a groundwater sample from a newly constructed domestic drinking water well.
Aquifers in our study are late Quaternary-age glacial aquifers in the northwestern and central part of the state, and fractured crystalline bedrock aquifers in the northeast (Figure 2).
Figure 2 – Study regions and representative geologic cross sections. Simplified surficial glacial geology (simplified from Hobbs and Goebel (1982)), and sampled well locations (data available online at https://doi.org/10.5066/F7736PVK). Northeast cross section (A, simplified from Knaeble and Hobbs (2009)), Northwest cross section (B; simplified from Gowan and Marshall (2016)) and Central cross section (C, simplified from Lusardi and Jennings (2009)) illustrate differences in typical well depth, complexity of layering, and characteristics of drinking water aquifers in the study regions. Wells on cross sections are not study wells. Reprinted with permission from Erickson et al., 2019.
Gowan, A.S., Marshall, K.J., 2016. County Atlas Series, Atlas C-42, PART A, Becker County, Plate 4—Quaternary Stratigraphy (Minneapolis, MN.).
Hobbs, H.C., Goebel, J.E., 1982. S-01 Geologic Map of Minnesota, Quaternary Geology, State Map Series (Minneapolis, MN).
Knaeble, A.R., Hobbs, H.C., 2009. County Atlas Series, Atlas C-19, PART A, Carlton County, Plate 3—Surficial Geology, Minnesota Geological Survey County Atlas Series (Minneapolis, MN).
Lusardi, B.A., Jennings, C.E., 2009. County Atlas Series, Atlas C-20 McLeod County, PART A, Plate 4—Surficial Geology (Minneapolis, MN).
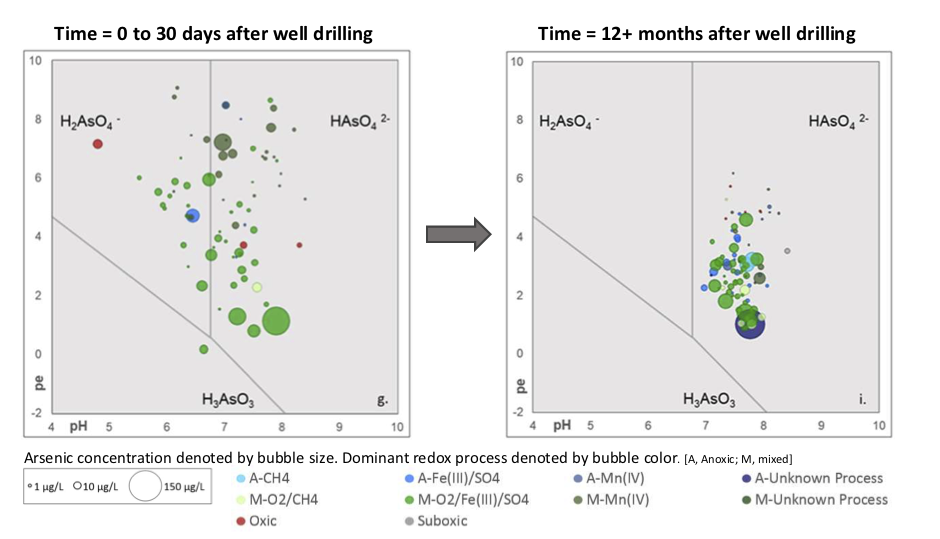
During the study, arsenic concentrations increased in glacial aquifer wells, and redox conditions became more reducing (Figure 3).

Figure 3 – Illustration of groundwater arsenic concentrations in the context of redox conditions and pH for 100 wells in central Minnesota on or close to the day the well was drilled compared to more than one year later. Data are shown for first and last sampling round (column), by redox category and process (color), and by concentration of arsenic (dot size). The data start with wide scatter (left, first round) and converge to redox stability over a year (right, last round). A, anoxic; M, mixed; CH4, methanogenic processes; Fe(III)/SO4; iron/sulfate processes; Mn(V); manganese processes; O2, oxygen processes. Study region location depicted on Figure 2. Reprinted with permission from Erickson et al., 2019.
Bedrock aquifer wells had no significant change in arsenic concentrations, and redox conditions became more oxic; some of the highest arsenic concentrations in the study were in bedrock aquifer wells. The arsenic concentration variability we identified has important implications for water treatment, and for programs that require testing of new wells, such as here in Minnesota and in New Jersey. Information on how and why concentrations of arsenic vary at new wells provides context on what constitutes a representative sample in situations where testing is required or desired. We evaluated methods used by well drillers to collect groundwater samples for arsenic analysis (Figure 4).
Figure 4 – Arsenic concentrations in well water in Minnesota, USA. Concentrations of arsenic in newly constructed wells approximately one year after well drilling. Data available online at https://doi.org/10.5066/F7736PVK. [µg/L, micrograms per liter]. Reprinted with permission from Erickson, Malenda, and Berquist, 2018
We found that water sampling protocols—filtration, timing, sample point—influence variability in arsenic concentrations in new drinking water wells. Variability in measured arsenic concentration at a well was reduced when samples were (1) filtered, (2) collected from household plumbing instead of from the drill rig pump, or (3) collected several months after well construction (instead of within 4 weeks of well installation). Particulates and fine aquifer sediments entrained in groundwater samples, or other artifacts of drilling disturbance, can cause undesirable variability in geochemical measurements,
including arsenic measurements. Establishing regulatory protocols requiring sample filtration and/or collection from household plumbing could improve the reliability of information provided to well owners and to secondary data users.
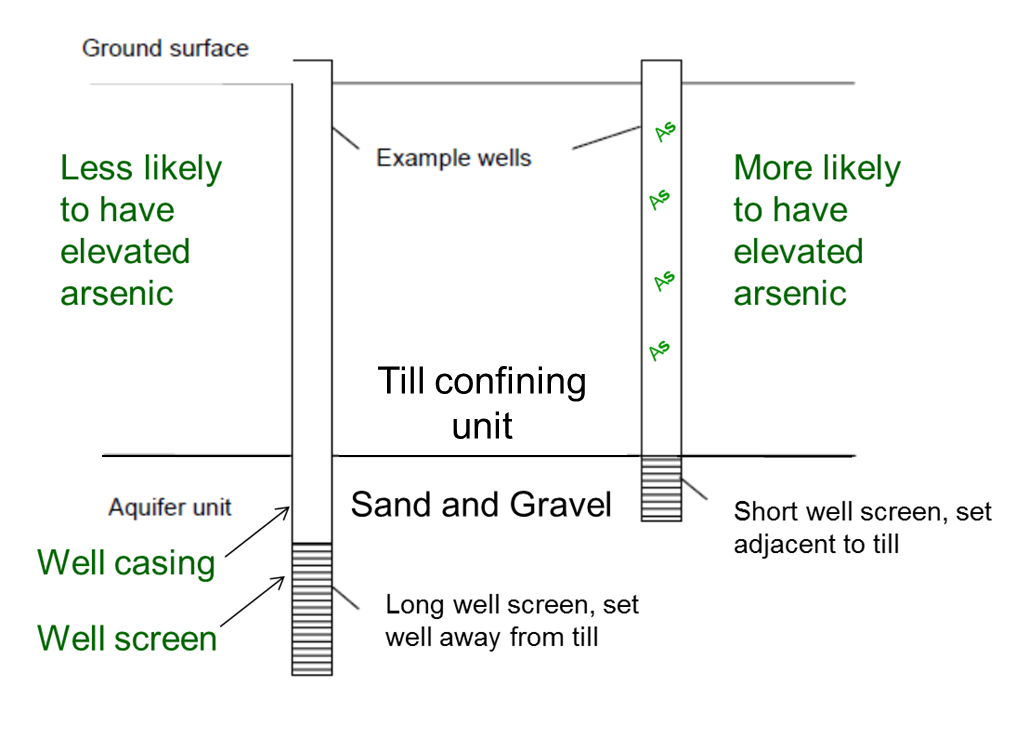
We developed a boosted regression tree (BRT) statistical model to assess the relation between arsenic concentration and hydrogeologic, geochemical, and well-construction factors. We found that variables describing aquifer properties and materials, position on the hydrologic landscape, and soil geochemistry were among the most influential for predicting the probability of elevated arsenic. We also found that certain well construction attributes were influential in predicting arsenic hazard. Smaller distances (proximity) between the top of the well screen and overlying aquitard (till or glacial lake deposit confining unit) and shorter well screen lengths were each associated with higher probabilities of elevated arsenic (Figure 5).

Figure 5 – Illustration comparing the construction characteristics of two water wells. Note that the distance from the top of the well screen to the confining unit, or aquitard, is much shorter for the well on the right, as is the length of the screen in the underlying aquifer unit. Placing a well screen farther beneath the confining unit and/or using a longer-length screen, as shown for the well on the left, can decrease the likelihood of elevated arsenic concentrations in domestic well water. Modified from Figure 1 in Erickson & Barnes, 2005, reprinted with permission.
Influential predictor variables, which are either mapped across the region or are well construction attributes, are proxies in the model for measurable physical or geochemical causes of elevated arsenic. Causes of elevated arsenic (e.g., redox condition, till or aquifer sediment chemistry, and water chemistry) are not mapped across the region. Our results show a new, novel, and important finding from an arsenic probability model: Controllable well construction choices (not just location or depth) influence arsenic concentrations in drinking water from wells.
There are multiple treatment options to reduce arsenic concentrations in drinking water. In Minnesota, the most common arsenic removal water treatment technologies are reverse osmosis and adsorptive media. Reverse osmosis uses a membrane to filter many contaminants based on size and molecular charge. Reverse osmosis is very effective at removing arsenic, but it produces wastewater and can be expensive. Adsorptive media describes positively charged media that attracts negatively charged arsenic ions, removing them from the water. Adsorptive media include activated alumina, iron-based media, and titanium and zirconium-based media. Other negative ions present in the water may also be removed and can attach to the media making arsenic treatment less effective. Distillation, oxidation filtration, and anion exchange are also treatment options.
To choose the right treatment system, it helps to understand what else is in the water (the water’s geochemistry) and what type of arsenic is present. There are also two types, or species, of arsenic found in drinking water: arsenic(V) or arsenic(III). The difference between the two is the strength of the molecular charge of the ion, which affects chemical reactions and requires different treatment strategies. Most treatment systems can remove multiple contaminants, and other contaminants may interfere with a treatment system’s removal ability or capacity. Most water treatment devices cannot effectively remove arsenic(III) without pretreatment using an oxidizer. After treatment is installed, proper maintenance and operation is important to ensure that the final water quality is safe. Learn more about Home Water Treatment options.
Ongoing work will help further identify ways that well drilling contractors and homeowners can minimize the risk of drilling wells with high concentrations of arsenic in groundwater.
This research was funded by the State of Minnesota Clean Water Fund through the Minnesota Department of Health and the U.S. Geological Survey Cooperative Matching Funds. The work was also supported by the National Science Foundation Graduate Research Fellowship Program and an internship provided through the Graduate Research Internship Program (GRIP). Any use of trade, firm, or product names is for descriptive purposes only and does not imply endorsement by the U.S. Government.
Recent project publications:
Erickson, ML, HF Malenda, EC Berquist. 2018. How or when samples are collected affects measured arsenic concentration in new drinking water wells. Groundwater, 56(6), pp 921-933. https://onlinelibrary.wiley.com/doi/abs/10.1111/gwat.12643.
Erickson, ML, HF Malenda, EC Berquist, JD Ayotte. 2019. Arsenic concentrations after drinking water well installation: Time-varying effects on arsenic mobilization. Science of the Total Environment, 678. pp 681-691. https://doi.org/10.1016/j.scitotenv.2019.04.362.
Erickson, ML, SM Elliott, CA Christenson, and AL Krall. 2018. Predicting geogenic arsenic in drinking water wells in glacial aquifers, north-central USA: accounting for depth-dependent features. Water Resources Research 54(12). https://doi.org/10.1029/2018WR023106.

